Machine Learning with Graph - Preliminaries part 1
This notebook covers introduction about graphs, its basic concepts and how to represent a graph. Primary source is from Standford CS224W course.


This is my personal notes for The Standford CS224W Course: Machine Learning with Graphs - Fall 2019 which I have been studying from its public resources for a couple of months. I will try to keep this blog series live update as my main source knowlege about graph. The course covers tremendous knowledge for understanding and effectively learning from large-scale network. In general, it is organized into 3 big sections:
-
preliminaries: provides basic background about networks/graphs. -
network methods: methods and algorithms which help us dealing with graph data structure. -
machine learning with networks: showing how we are applying machine learning into this field.
This notebook is part 1 of the preliminary section in which we will introduce about networks/graphs, its basic concepts and how to represent it.
Here is the link to other parts: 1.
Network Introduction and why should we care?
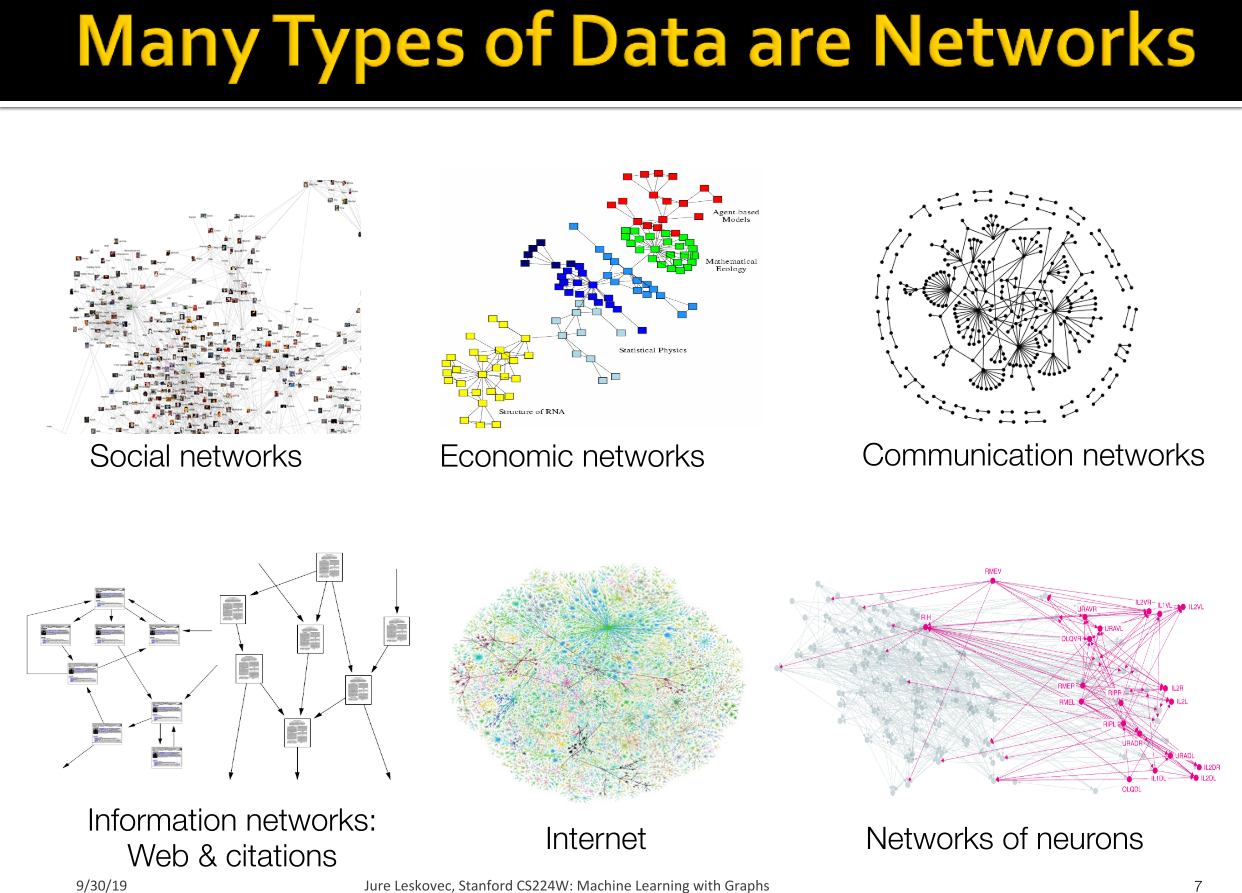
Networks are a general language for describing complex systems of interacting entities. Pictorially, rather than thinking that our dataset consists of a set of isolated data points, we consider interactions and relationships between these points.
In general, there are 2 types of networks/graphs:
-
Networks are those that can be interpretated as examples of phenomena that appear in natural world, that's why it is also called Natural Graphs. A couple examples include
- The human social network(a collection of 7+ billion individuals)
- Internet communication systems(a collection of electronic devices)
-
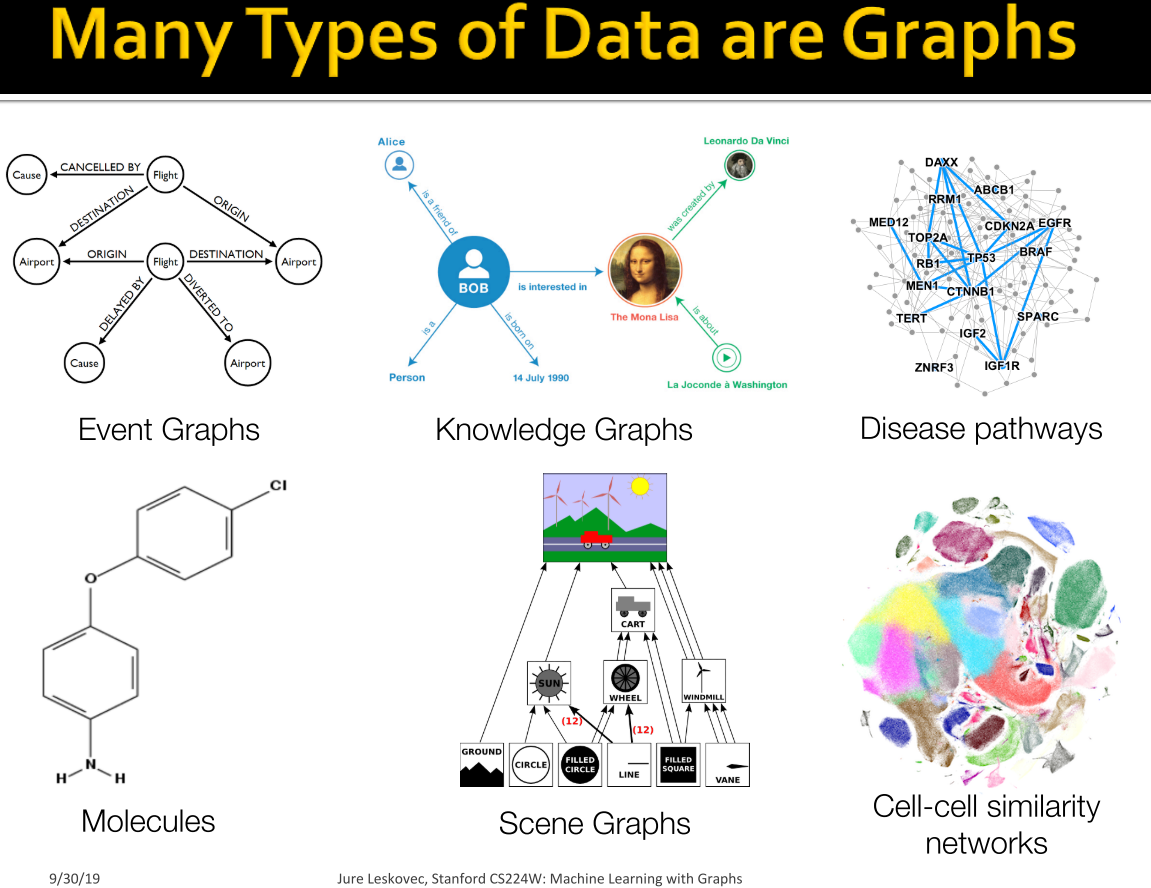
Information Graphs are those that can be interpretated as a data structure useful which are created in a heuristic way for solving a specific prediction problem. In this case, we're more interested in relationships between entities so we can efficiently perform learning tasks. Some examples include
- Information/knowledge (are organized and linked for a specific purpose,e.g google search engine)
- Scene graphs (how objects in a scene relate to one another)
- Similarity networks (in which similar points in a dataset are connected)
While working with Networks, some of the main questions that we need to think about are How are these systems organized? what are their design properties? Behind many systems there is an intricate wiring diagram, a network, that defines the interactions between the components. We will never be able to model and predict these systems unless we understand the networks behind them.
In the other hand, working with Graphs leverages another questions How do we take advantage of relational structure for better prediction? Complex domains (knowledge, text, images, etc) have rich relational structure, which can be represented as a relational graph for numerous prediction tasks. By explicitly modeling relationships and applying machine learning into graph, we achieve better performance in many tasks.
Sometimes the distinction between network and graph is blurred and we will use them interchangeably in this blog series.
There are many ways to analyse a network/graph:
- Node classification, where we predict the type/color of a given node
- Link prediction, where we predict whether two nodes are linked
- Community detection, where we identify densely linked clusters of nodes
-
Similarity computation, where we measure the similarity of two nodes or networks.
Note: two popular graph analysis tools are SNAP and NetworkX
Nowadays, network is applied in various fields with many successes. Some of the main applications include
-
Network application in the social networks.
We can map a social network, e.g. facebook social network, as a graph and play around with it, try to understand how it is organized? how a group of people is connected? how to advertise a product more efficiently in our network?. One of the popular tasks with social network is community detection. Throughout this task, we can explore a lot of information stays behind our network.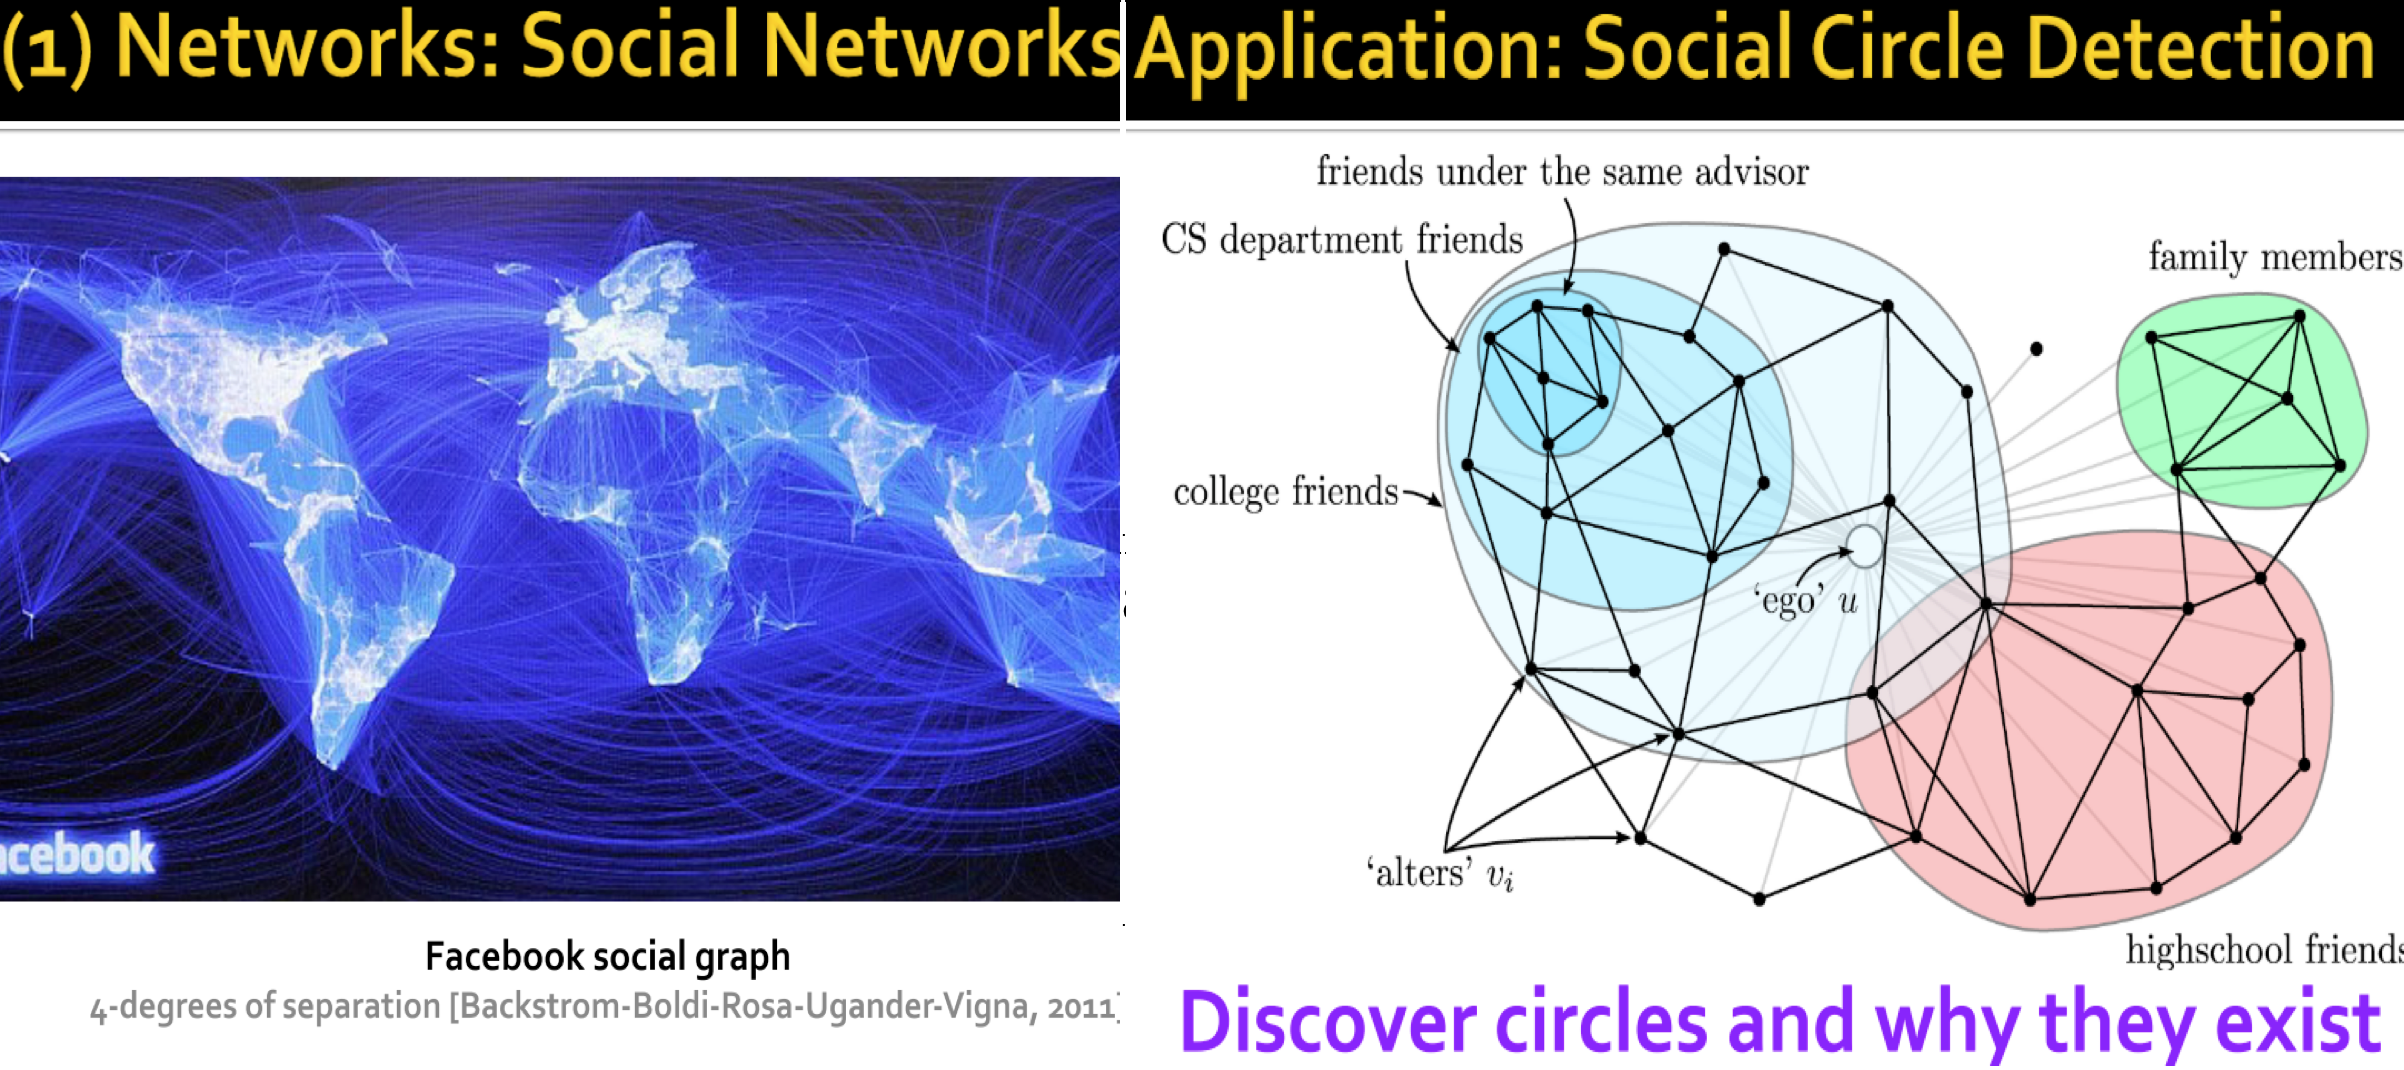
-
Network application in infrastructure design.
A typical example is the light outage in East Coast of America back in 2003. This is a kind of cascading failures where outage at a city led to failures at another cities. So the question is how can we design a robust system? how can we prevent such kind of cascading failures? By mapping the power grid as a graph and modeling this cascading behaviour, we can improve the power infrastructure design. In reality failures follow reproducible laws, that can be quantified and even predicted using the tools of networks. -
Network application in Knowledge (Knowledge Graphs).
We can encode knowledge of a domain into graph and use it for downstream tasks. These graphs can even be heterogeneous, in a sense that nodes and links can be in different types. Or it can be multimodal where nodes/edges can be categorised into different groups.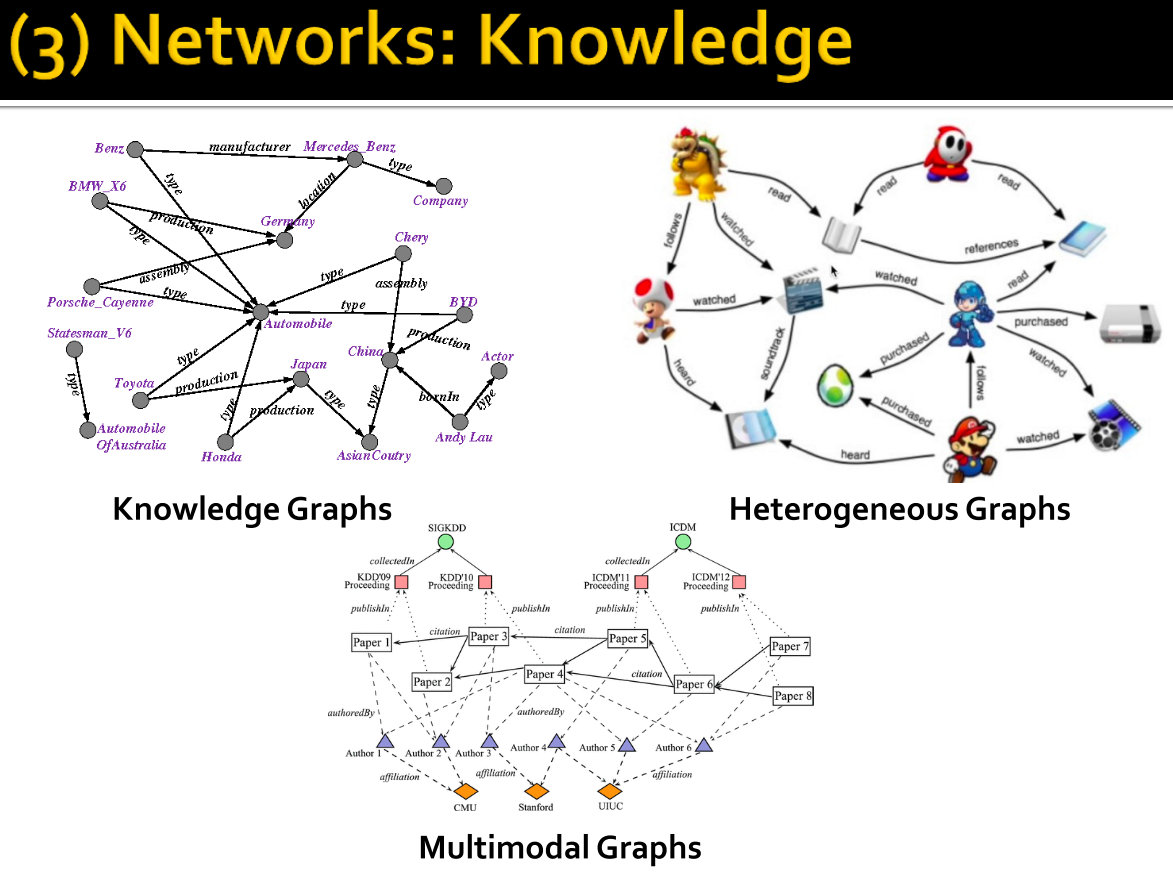
-
Network application in Online Media.
We can use data from twitter to map polical blogs into graph and analyse the political polarization between them. Or we can use graph's power to detect whether a given Wikipedia article is a hoax. In addition, we can also use graph in viral marketing in which we try to maximize the social impact by selecting a subset of famous people to advertise for us. And another application is product adoption where you have a new product and you are interested in how far your product will spread via inviations, how to optimize this spread.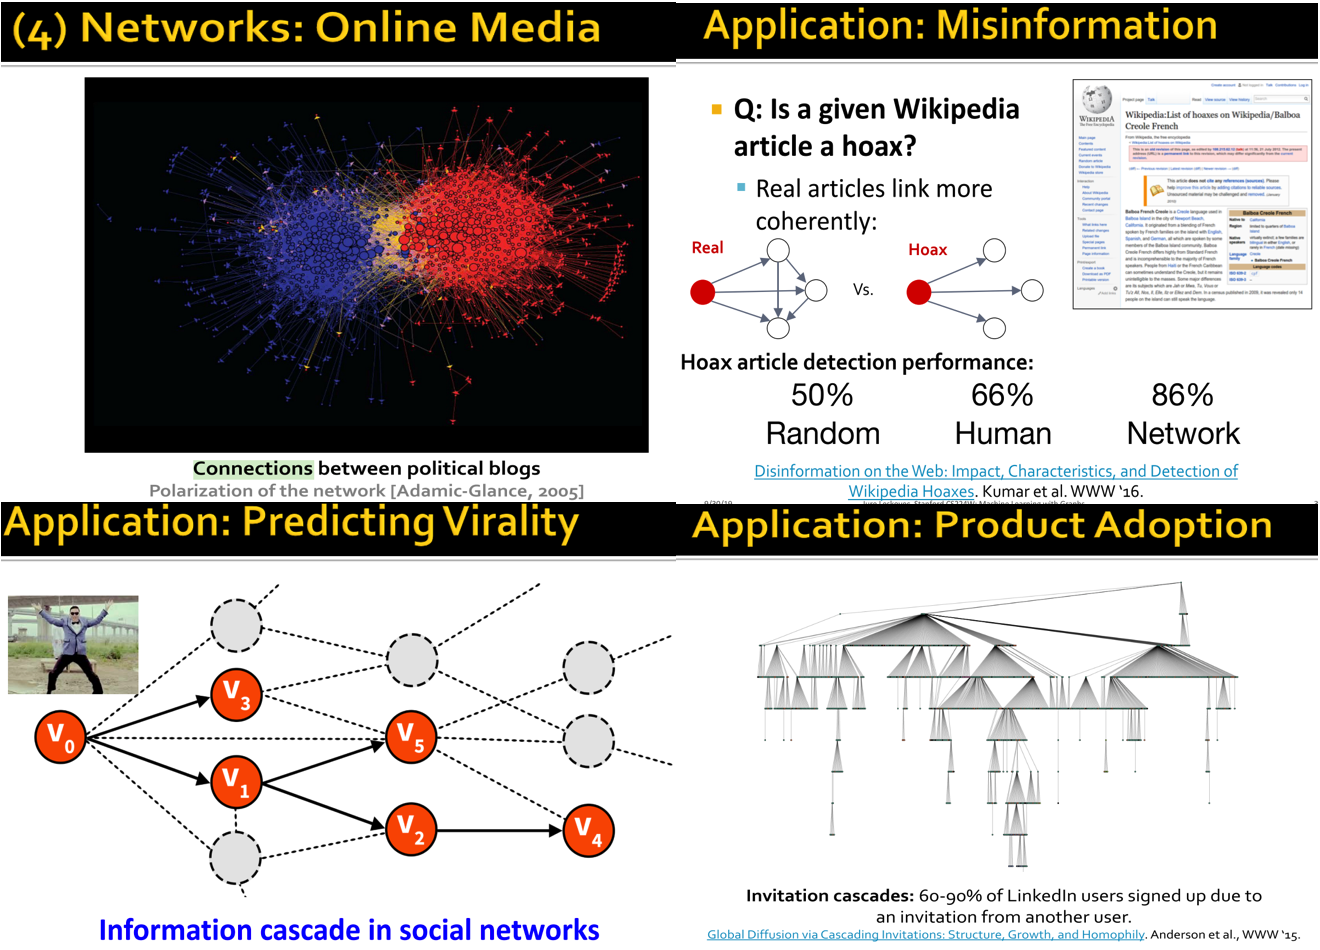
-
Network application in Biomedicine.
A typical example application of graph in this field is to predict side effects of a given pair of drugs. This is a kind of link prediction where we need to predict which kind of effects might occur between two drug nodes.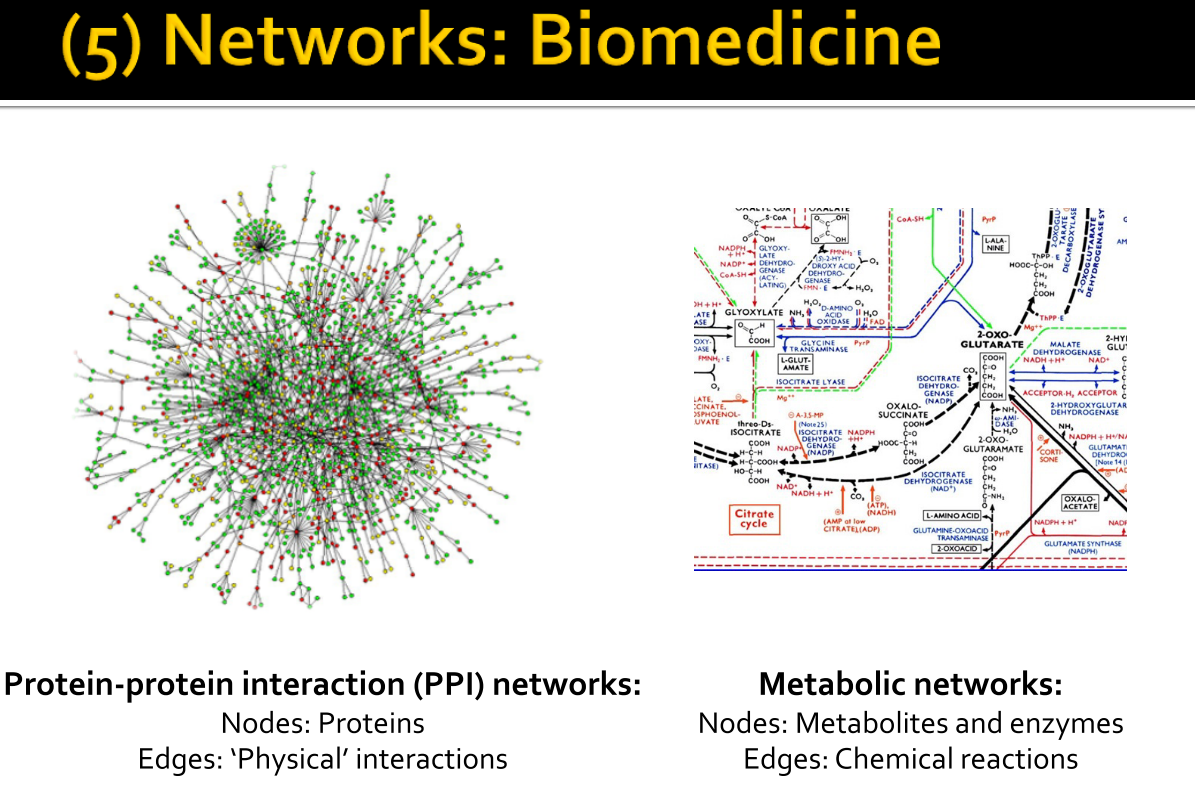
Altogether, networks are a universal language for describing complex data, and generalize across a variety of different fields. With increased data availability and a variety of computational challenges, learning about networks leaves one poised to make a wide variety of contributions.
Basic Concepts
Structure of Graphs
A network/graph $G(N,E)$ is a collection of objects (nodes) $N$ where some pairs of objects are connected by edges/links $E$:
- Objects: nodes, vertices N
- Interactions: links, edges E
- System: network, graph G(N,E)
Note: Technically, a network often refers to real systems (the web, a social network, etc) while a graph often refers to the mathematical representation of a network (a web graph, social graph, etc).Note: groups of technical terms - network, node, link vs. graph, vertex, edge. However, in most cases these terms are used interchangeably.
Both nodes and edges can contain information that is encoded as node attributes, edge attributes, respectively. There are many options for edge attributes such as:
- Weight (e.g. frequency of communication)
- Ranking (best friend, second best friend...)
- Type (friend, relative, co-worker)
- Sign: Trust vs. Distrust
- Properties depending on the structure of the rest of the graph: number of common friends.
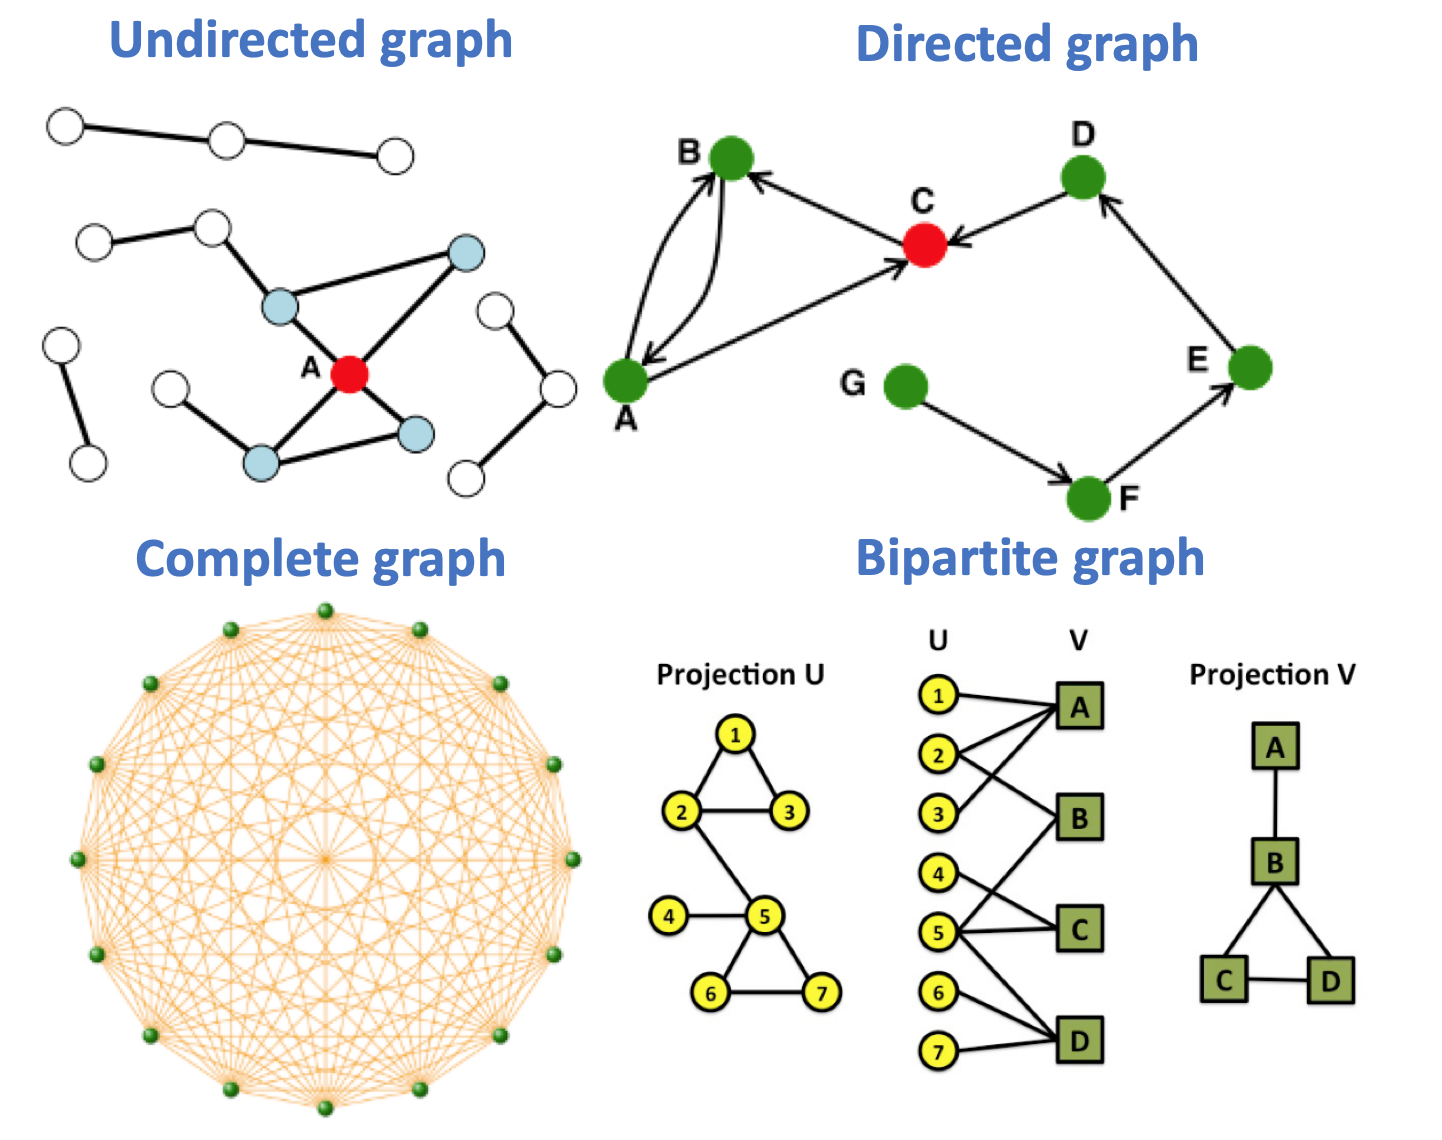
Undirected graphs are those with symmetrical/reciprocal links(e.g.friendship on Facebook). Node degree $k_i$ of node $i$ in an undirected graph is defined as the number of edges adjacent to node $i$. For example the degree of node A in the undirected graph below $k_A=4$.
The average degree is then
\begin{equation}
\bar{k}=\langle k\rangle=\frac{1}{|N|} \sum_{i=1}^{|N|} k_{i}=\frac{2|E|}{N}
\end{equation}
Directed graphs are those with directed links(e.g.following on Twitter). In these graphs, In-degree $k_{i}^{in}$ is defined as the number of edges entering node $i$. Similarly, out-degree $k_{i}^{out}$ is defined as the number of edges leaving node $i$. The (total) degree of a node is the sum of in- and out-degrees.
For example the degree of node C in directed graph below: $k_{C}^{in}=2, k_{C}^{out}=1, k_C=2$
The average degree is $\bar{k}=\langle k\rangle=\frac{|E|}{N}$
Complete graphs are undirected graphs with the maximum number of edges. Intuitively speaking, complete graph has all pairs of nodes connected. The complete graph has number of edges $|E|=\left(\begin{array}{c}N \\ 2\end{array}\right)=\frac{N(N-1)}{2}$ and average degree $\bar{k}=|N|-1$.
Bipartite Graphs are those whose nodes can be divided into two disjoint/independent sets $U$ and $V$ such that every edge connects a node in $U$ to a node in $V$, there are no edges between nodes in $U$ and between nodes in $V$. Examples author-to-papers(they authored), actors-to-movies(they appeared in), etc.
Bipartite graphs can be projected into Folded Networks by creating edges within independent sets $U$ or $V$ if they share at least one common neightbor. Looking at node 1 of projection $U$ in bipartite graph below, it is connected to node 2 and node 3 because node 1, 2, 3 all have common neightbor A.
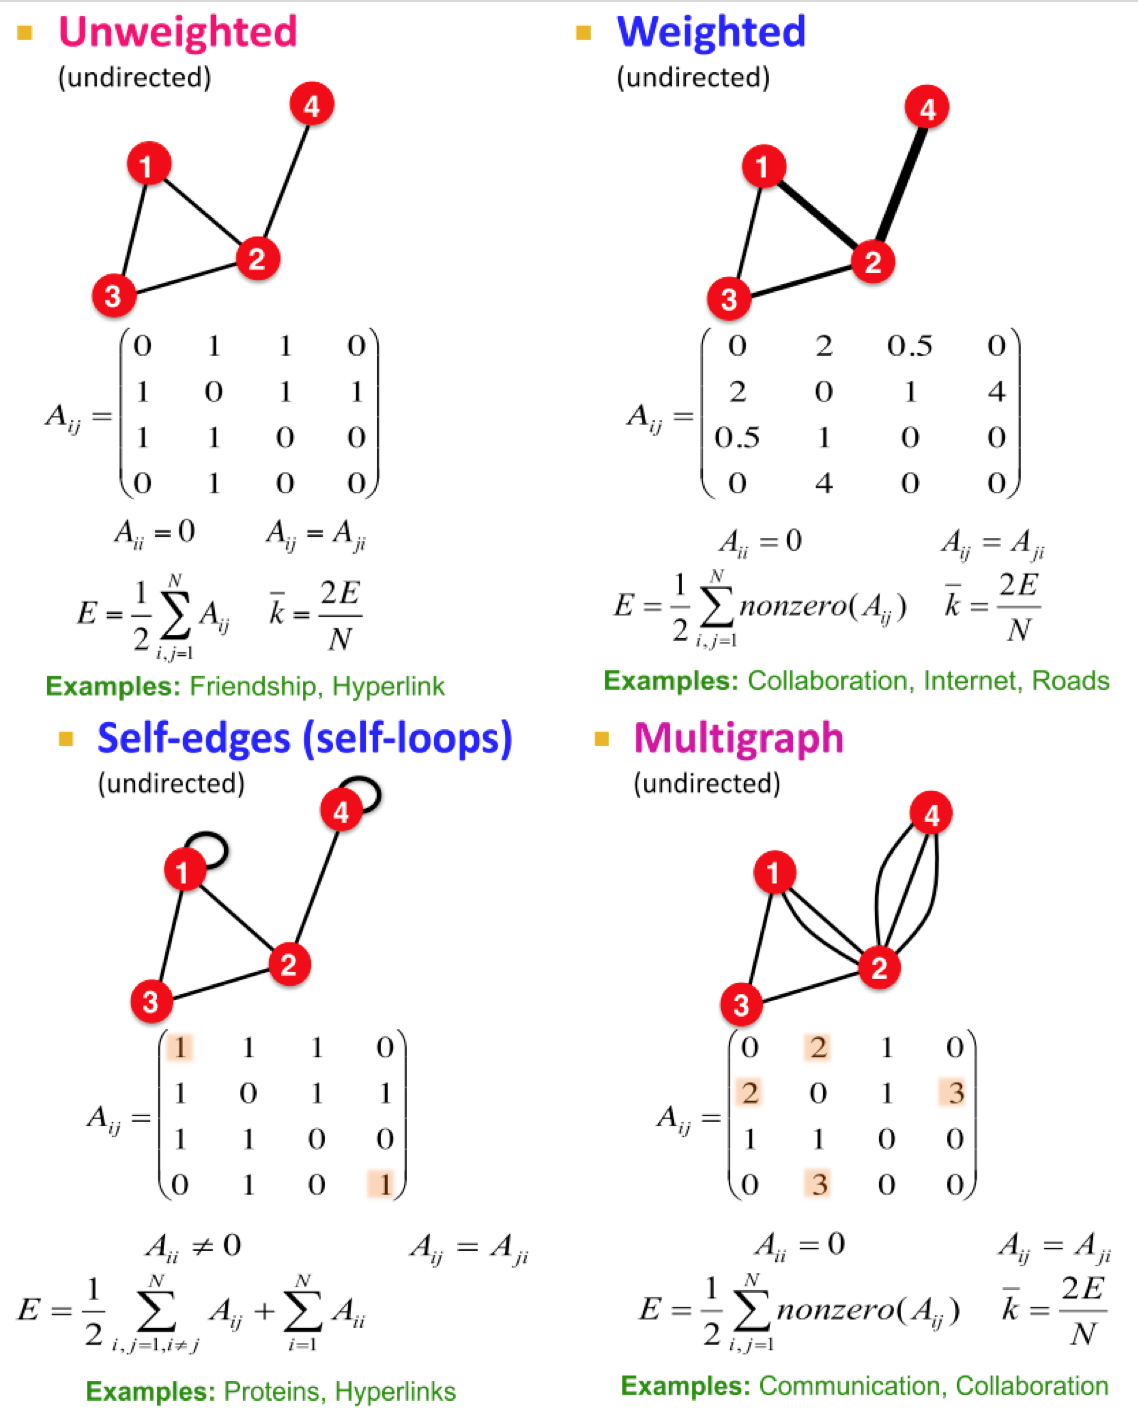
Other Graph Types we briefly note that graphs can also include self-edges(self-loops), weights associated with edges, and multiple edges connecting nodes. These attributes can be encoded in graph representation with ease.
Graph Representation
There a 3 ways to represent a graph $G$:
-
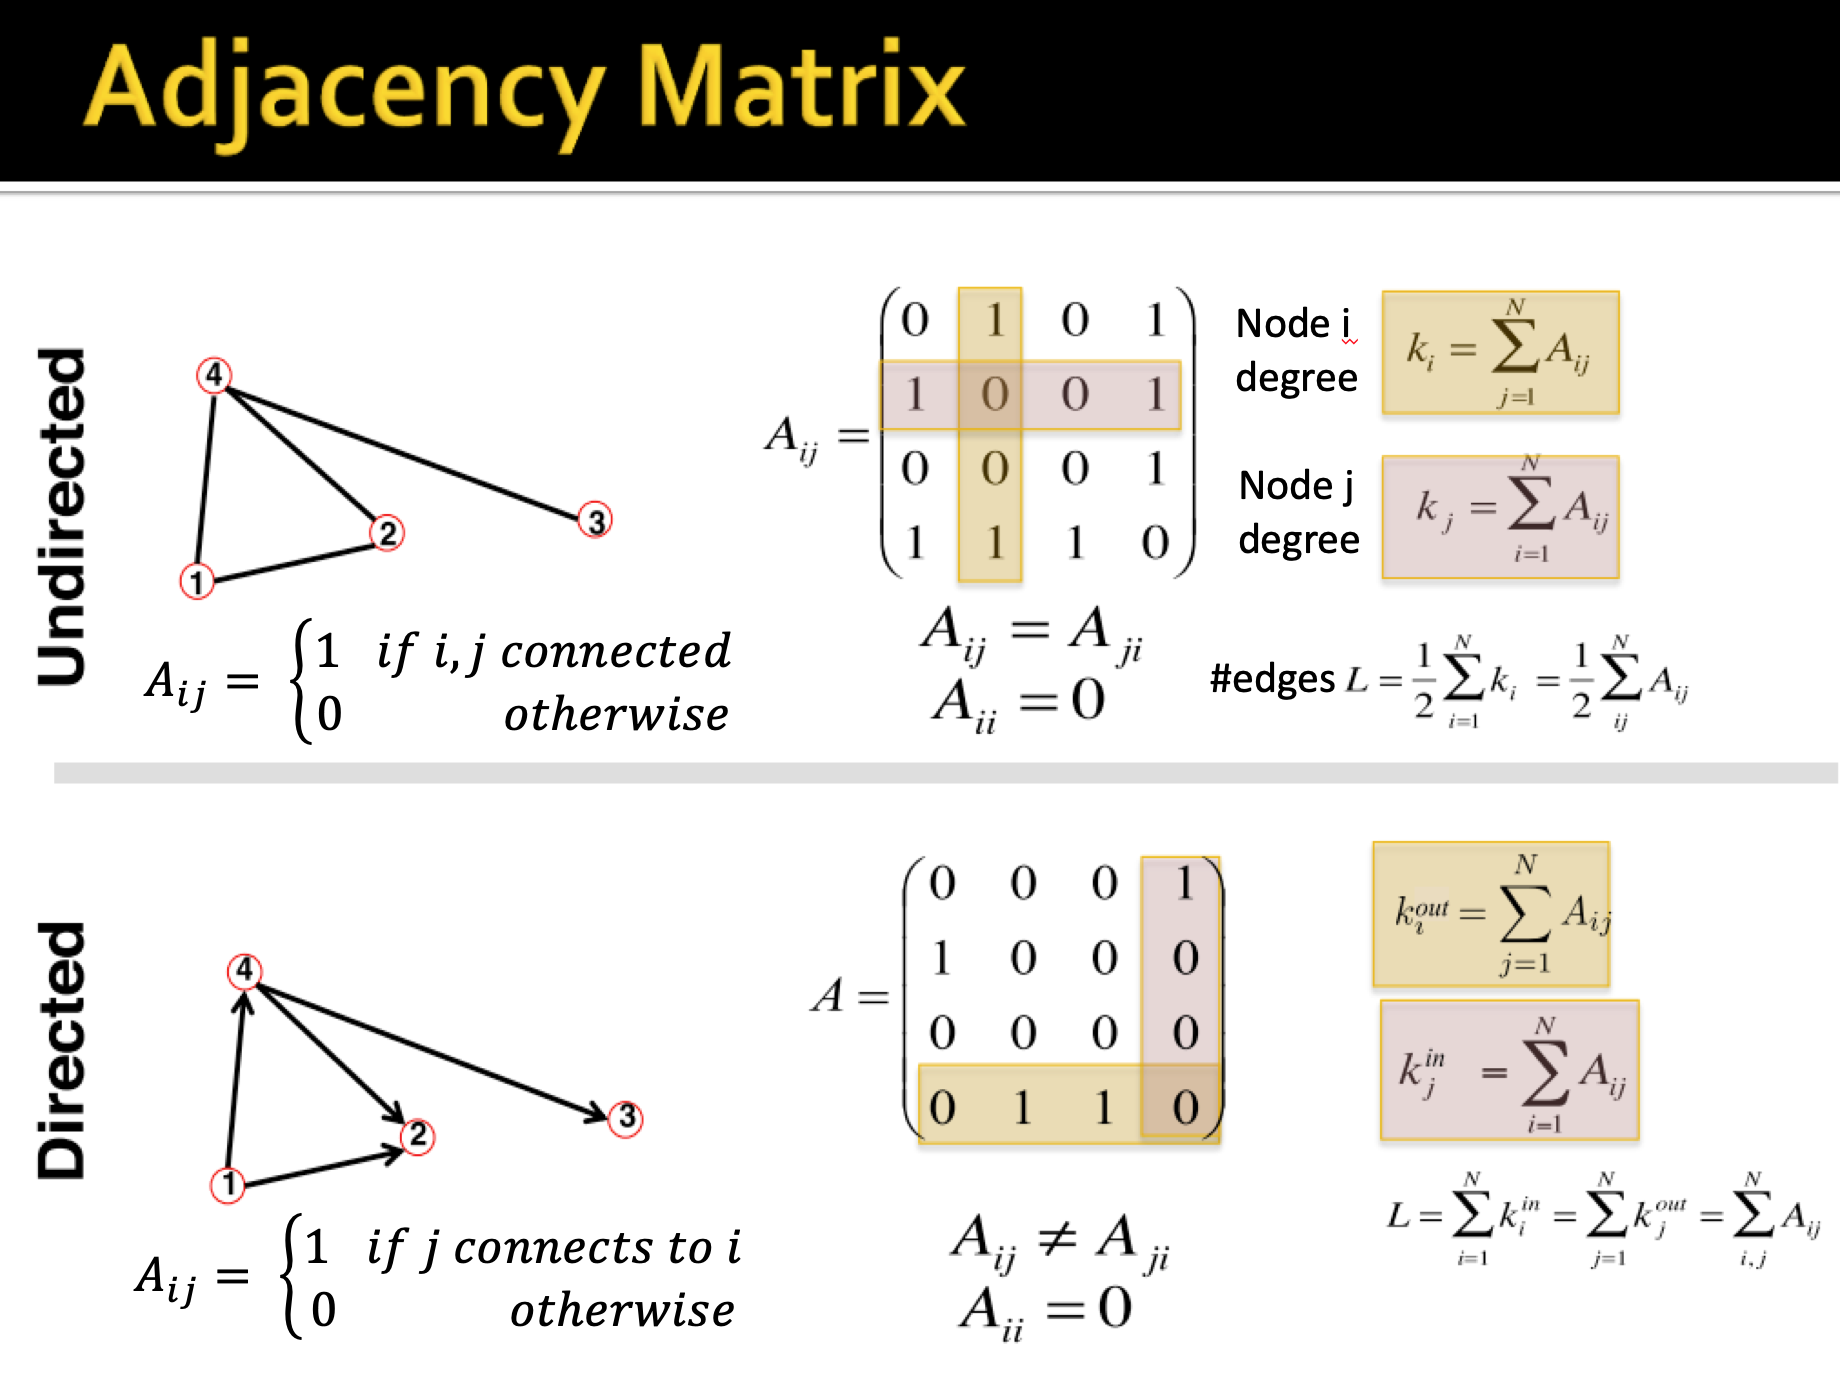
Adjacency matrix: is one of the most common way to represent a matrix. The image below shows all information we need to know about directed and undirected graph. Notice that adjacency matrix is symmetric for undirected graph and asymmetric for directed graph. However, most real-world networks are sparse ($|E| \ll E_{\max}$ or $\bar{k} \ll |N|-1$). As a consequence, the adjacency matrix is filled with zeros, it is an undesirable property!
-
Edge List: a graph can be represented as a set of edges(edge list). An example of edge list with the directed graph above [(1,4), (4,2), (4,3), (1,2)]. This representation makes edge lookups harder but preserves memory (alleviate mentioned above with adjacency matrix).
-
Adjacency list: This method is easier to work with if the network is large and sparse. It also allows us to quickly retrieve all neightbors of a given node. Example adjacency list for the directed graph above {1:[4,2], 2:[], 3:[], 4:[2,3]}
Graph Connectivity
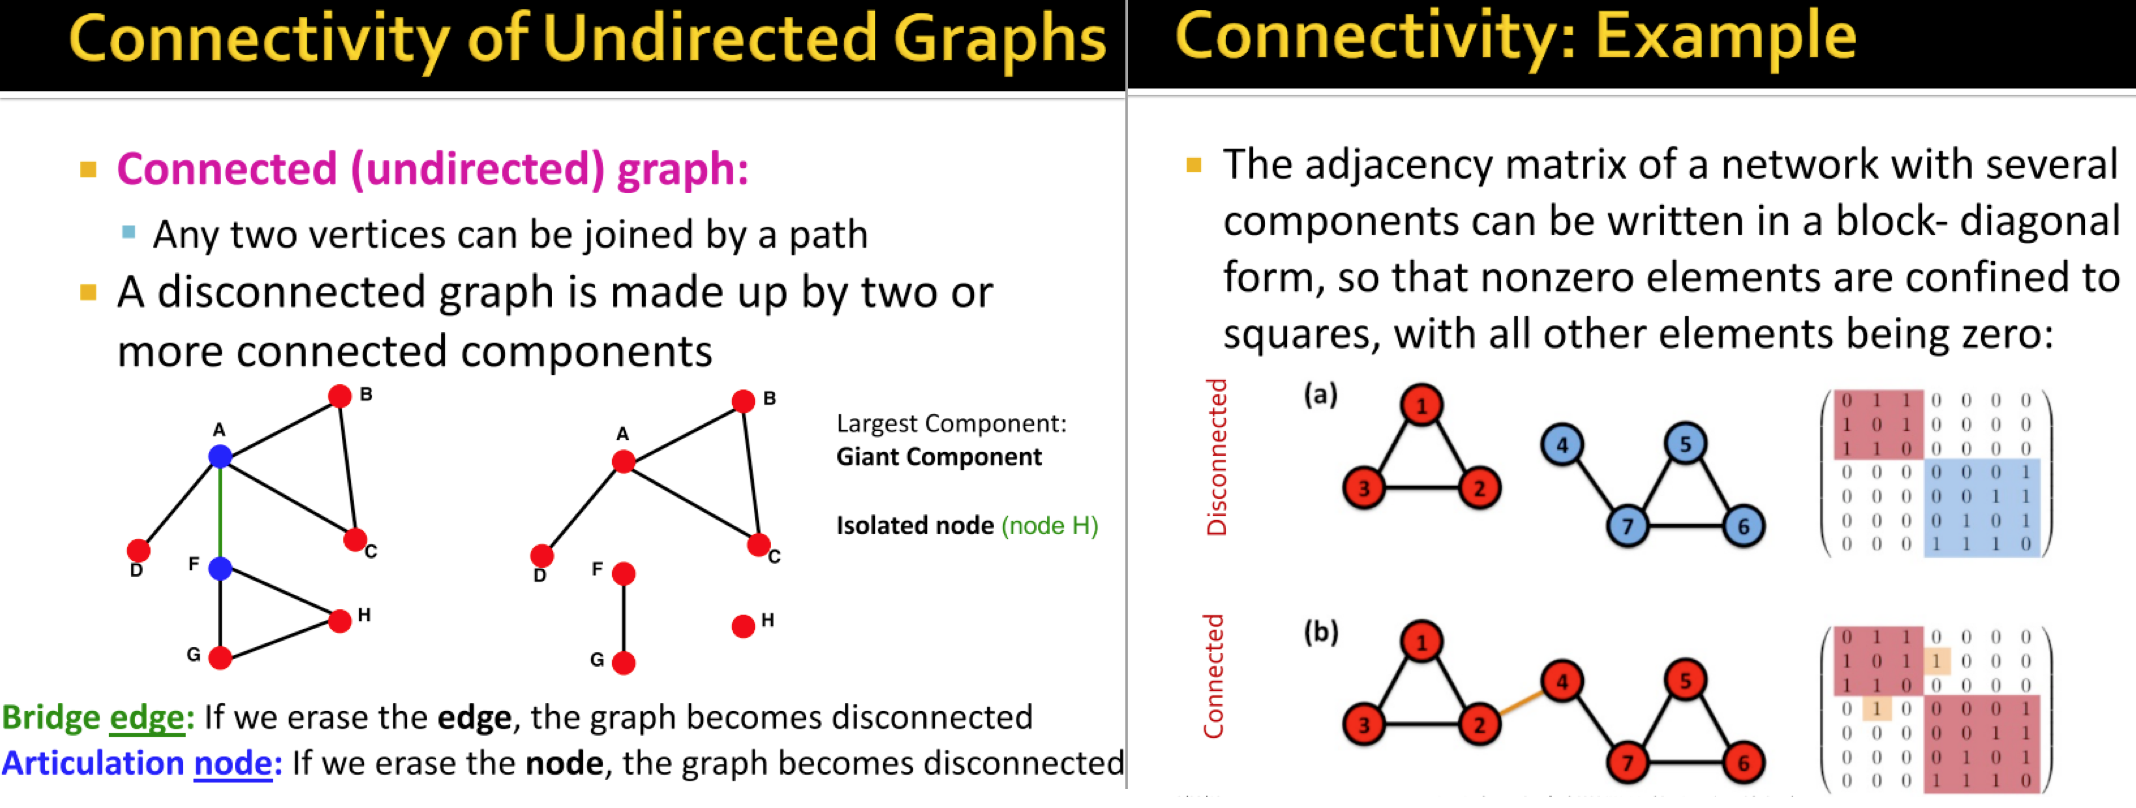
A undirected graph is called connected if there is a path between any pair of nodes in the graph. A graph is called disconnected if it is made up by two or more connected components.
The image below shows primary concepts about connectivity characteristic of an undirected graph such as connected(undirected) graph, disconnected(undirected) graph, giant component, isolated node, bridge edge, articulated node. In addition, the adjacency matrix of such networks can be represented as a block-diagonal form.
We can further extend the connectivity concepts from undirected to directed graphs by defining strongly connected directed graph, weakly connected directed graph, strongly connected components.

Altogether, the way we define a network, the way we choose a proper network representation of a given domain/problem determines our ability to use network successfully. In some cases, there is a unique, unambiguous representation but in other cases, the representation is by no means unique. The way we assign links will also determine the nature of question we can study. Here is some examples of network representations:
- Email network: can be represented as directed multigraph with self-edges graphs.
- Facebook friendships: can be represented as undirected, unweighted graphs.
- Citation networks: can be represented as unweighted, directed, acyclic graphs.
- Collaboration networks: can be represented as undirected multigraph or weighted graphs.
- Mobile phone calls: can be represented as directed, (weighted?) multigraph.
- Protein interactions: can be represented as undirected, unweighted with self-interactions graphs.
References
- main source: Standford CS224W Machine Learning with Graphs
- other sources
- Graph on structured documents blog post
- Graph theory blog post
- Graph embedding blog post
- Graph convolution blog post
- Geometric deep learning blog post
- review papers about graphs: 1, 2
- Pytorch Geometric:1, 2